REPORT | AUGUST 2025
This document is an overview of this seminal report and is meant to be a primer/introduction to the full report. A link to the full report is given above and it should be read for a more comprehensive understanding.
Embodied Carbon Pathways to 2050 for the United States, a collaboration between the Carbon Leadership Forum (CLF), RMI, and the University of Washington (UW) Life Cycle Lab, provides an assessment of embodied carbon from US construction materials and explores pathways to align with a 1.5°C global warming limit.
Key Takeaways
1. Embodied carbon reductions are not on pace with 1.5C targets.

2. The three emission reduction curves (Figure 8) are based on attribution principles recommended by the Science Based Technology Institute. This report does not state which of the three reduction curves it recommends. In our opinion the “ability to pay” line should be followed as it represents a U.S. leadership position in embodied carbon emission reductions.
3. The report uses as a baseline for New Building Construction the A1-A3 life cycle stages, and a scope of Structural, Envelope, Interiors-construction, and Interiors-finishes (floors, walls, ceilings). Figure 5 shows the estimated GWP from 2020 to 2050 in the 10 most impactful material categories.

4. Infrastructure embodied carbon emissions (excluding New Building Construction) are about equal to New Building Construction emissions, with material inclusions limited to sand & gravel, steel, asphalt mixtures, and concrete.
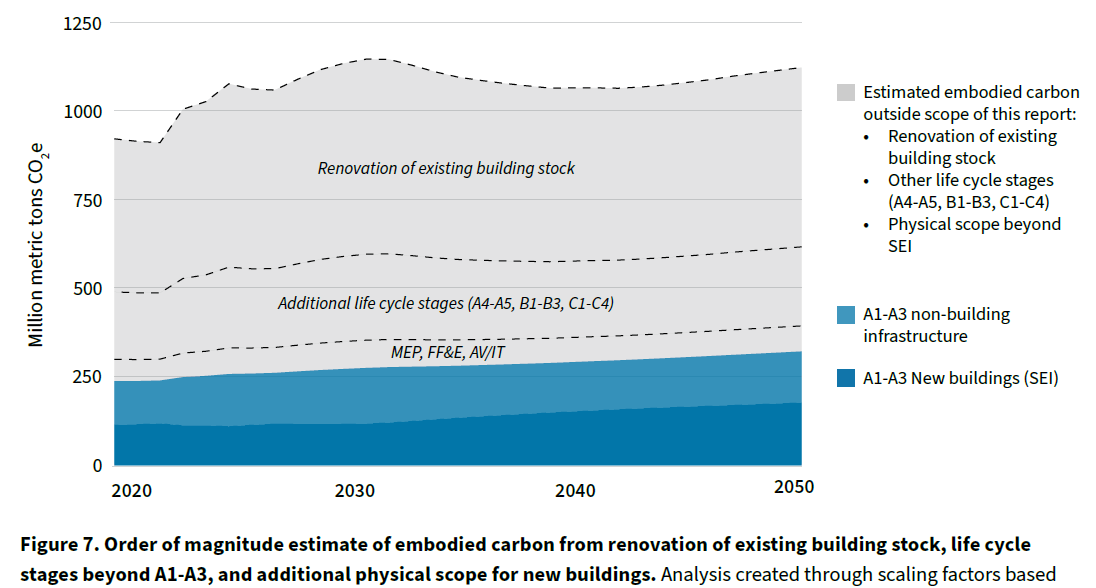
5. When including MEP, FF&E, and Audio Visual and IT building systems and looking at the full building life cycle, the embodied carbon emissions are approximately double that of New Building Construction + Infrastructure. The renovation of existing building stock was not included in the New Building Construction + Infrastructure values, and the (substantial) estimated emissions are as shown in Figure 7.
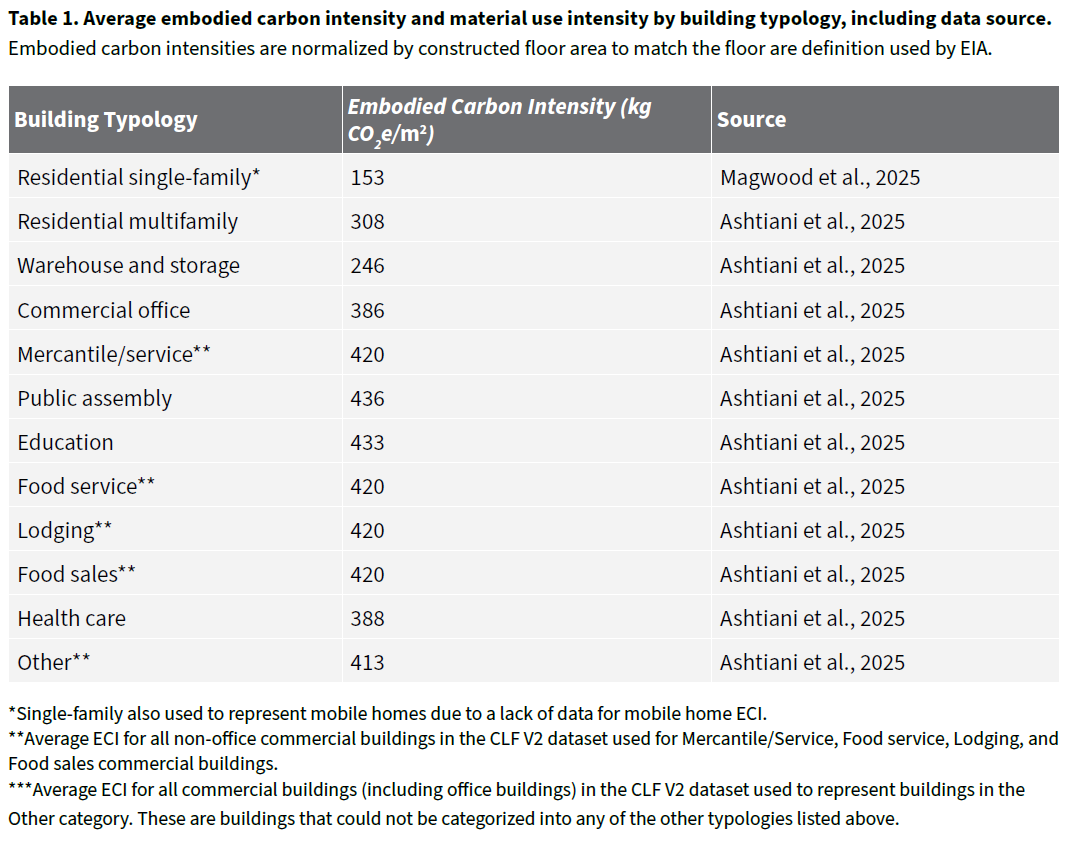
6. The embodied carbon intensity (kg CO2e/m2) for New Building Construction are shown in Table 1.
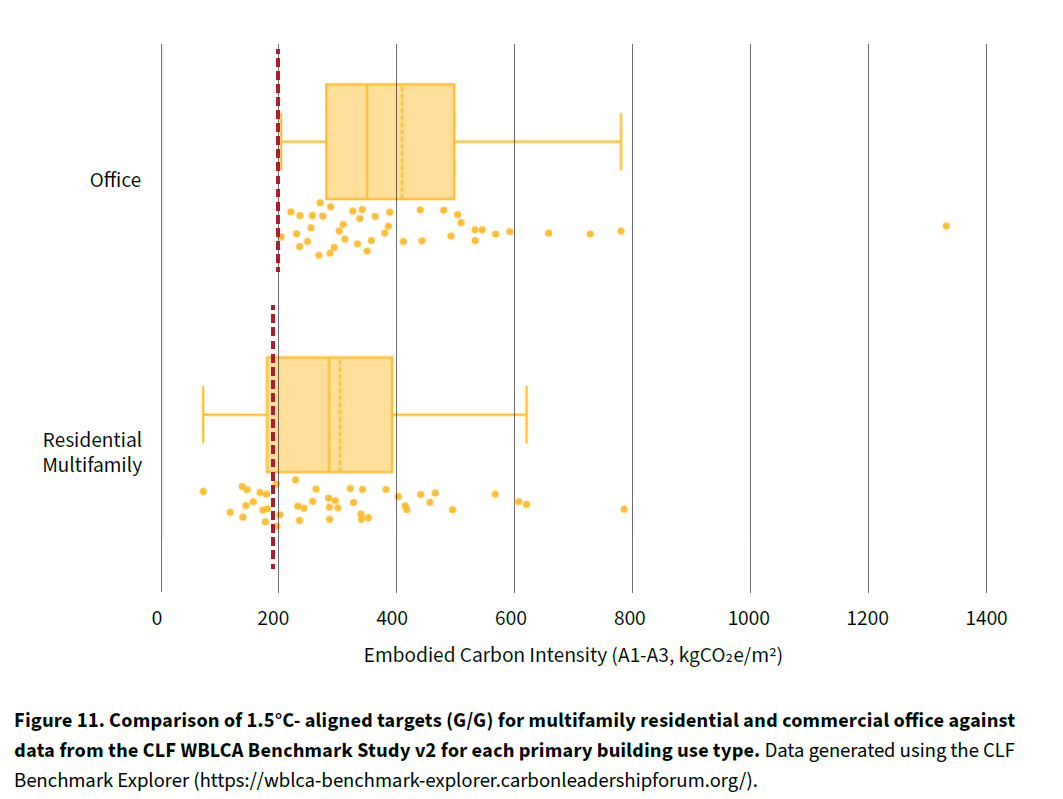
7. The 2025 targets are achievable today using current techniques as shown in Figure 11.
8. Figure 12 summarizes the emissions reduction potential for each strategy identified in the reviewed research, organized by material category. (Figure 12a shown below)
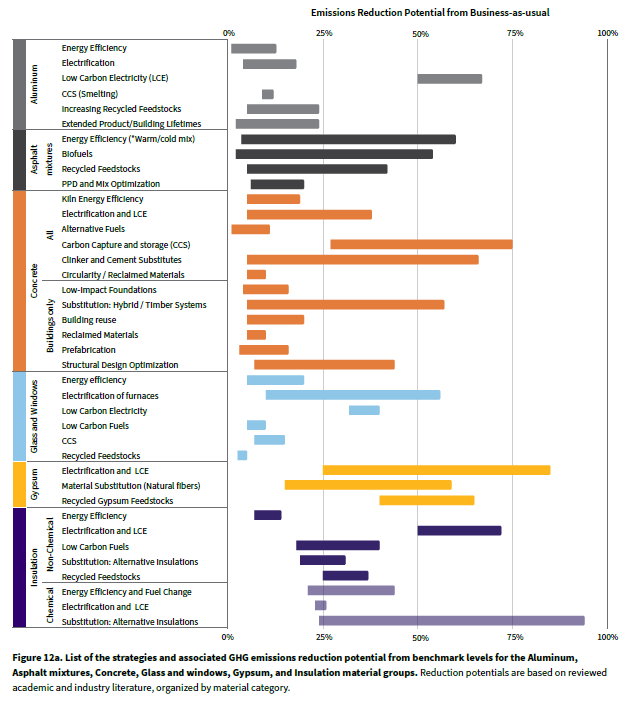
(Figure 12b shown below)
9. The “Best Case” scenario is the only scenario that approaches zero embodied carbon by 2050.
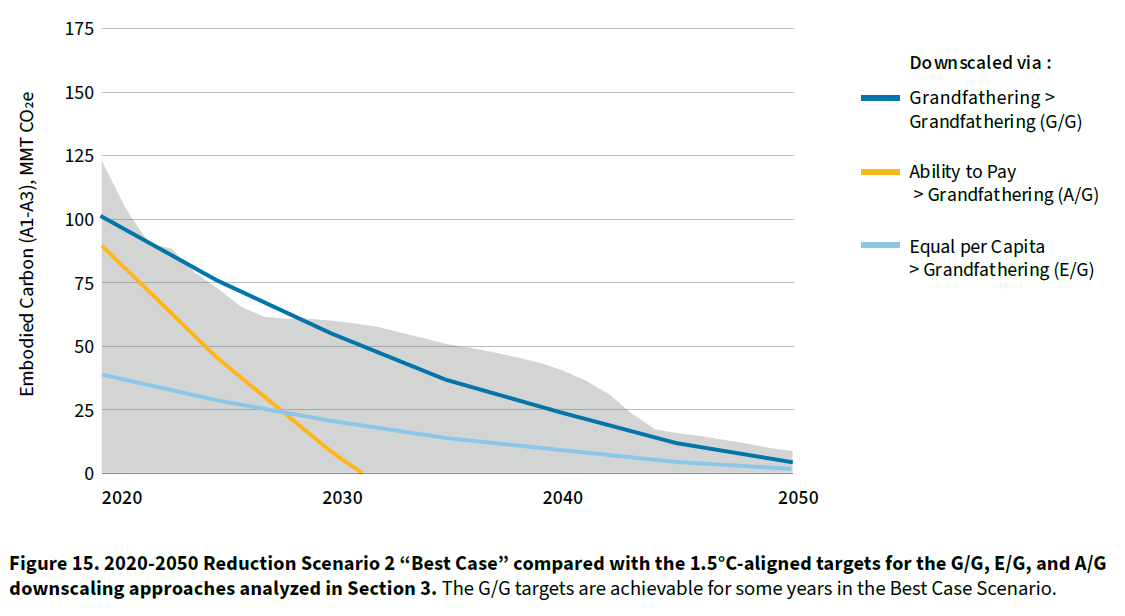
10. Target embodied carbon reductions for New Building Construction using “Best Case” scenario compared to the three attribution principles are shown in Figure 15. The grey shaded background represents the embodied carbon reduction of the 10 material categories shown in Figure 5 above.
11. Utilizing the “Best Case” scenario still leaves residual emissions that need to be reduced by sequestration to meet the 1.5C budget. This is depicted along with the residual emissions of the other scenarios in Figure 17.

12. Policy actions that support reduction pathways of the “Best Case” scenario are shown in Figure 18.

13. Biogenic carbon is excluded from this report.
14. This report is a call to action. Scaling best practices while advancing emerging technologies is critical in reaching climate targets.
15. Multiple strategies are required including material substitution, design optimization, electrification, and carbon capture.
16. The deployment of aggressive policy frameworks is indispensable.
17. U.S. states and cities need to lead by developing effective policies.