
BENCHMARKS & BASELINES
CECC has developed a baseline model that provides Embodied Carbon Intensity (ECI) based on 6 primary building systems and multiple stage options. The purpose of this model is to provide baseline information for 12 different building use types that allows multiple combinations of building systems and stages.
The 6 building systems modeled are Structure, Enclosure, Interiors Construction, Interiors Finishes, MEP, and FF&E. The stages modeled for these building systems are (A1-A3), (A4-A5), (B4-C), and (A-C).
A word about baselines vs. benchmarks. We developed this model to set a 2020 baseline for these 12 building types with the intent to extend them to benchmark targets to be consistent with the budgets for global average temperature targets of 1.5C and 1.7C. In April of 2025, the Carbon Leadership Forum (CLF) released The Embodied Carbon Benchmark Report based on the WBLCA results of 292 buildings submitted by engineers and architects, and vetted by the CLF team. The benchmarks in this report were defined as “…. reference points of environmental impacts of buildings against which comparisons can be made.” The benchmarks in the CLF report are meant to provide practitioners with a benchmark of Embodied Carbon Intensity to compare their buildings to using high, medium, and low values. At this time CECC is pursuing both the current approach of CLF and a target-based benchmark that uses the “baselines” we modeled and extends them to benchmarks consistent with global climate targets.
For our initial presentation of our model results, we developed two graphics to depict the comparison of the CECC model with the CLF results and a recent article by Perkins&Will. This comparison is based on stages (A1-A3) and the Structure, Enclosure, and Interiors building systems.
The first chart is a presentation of the Embodied Carbon Intensity (ECI) values from each of the three sources. The building use types do not always align, so all of the use types in the source documents were used:

The second chart shows a graphic comparison of these results using bar charts:
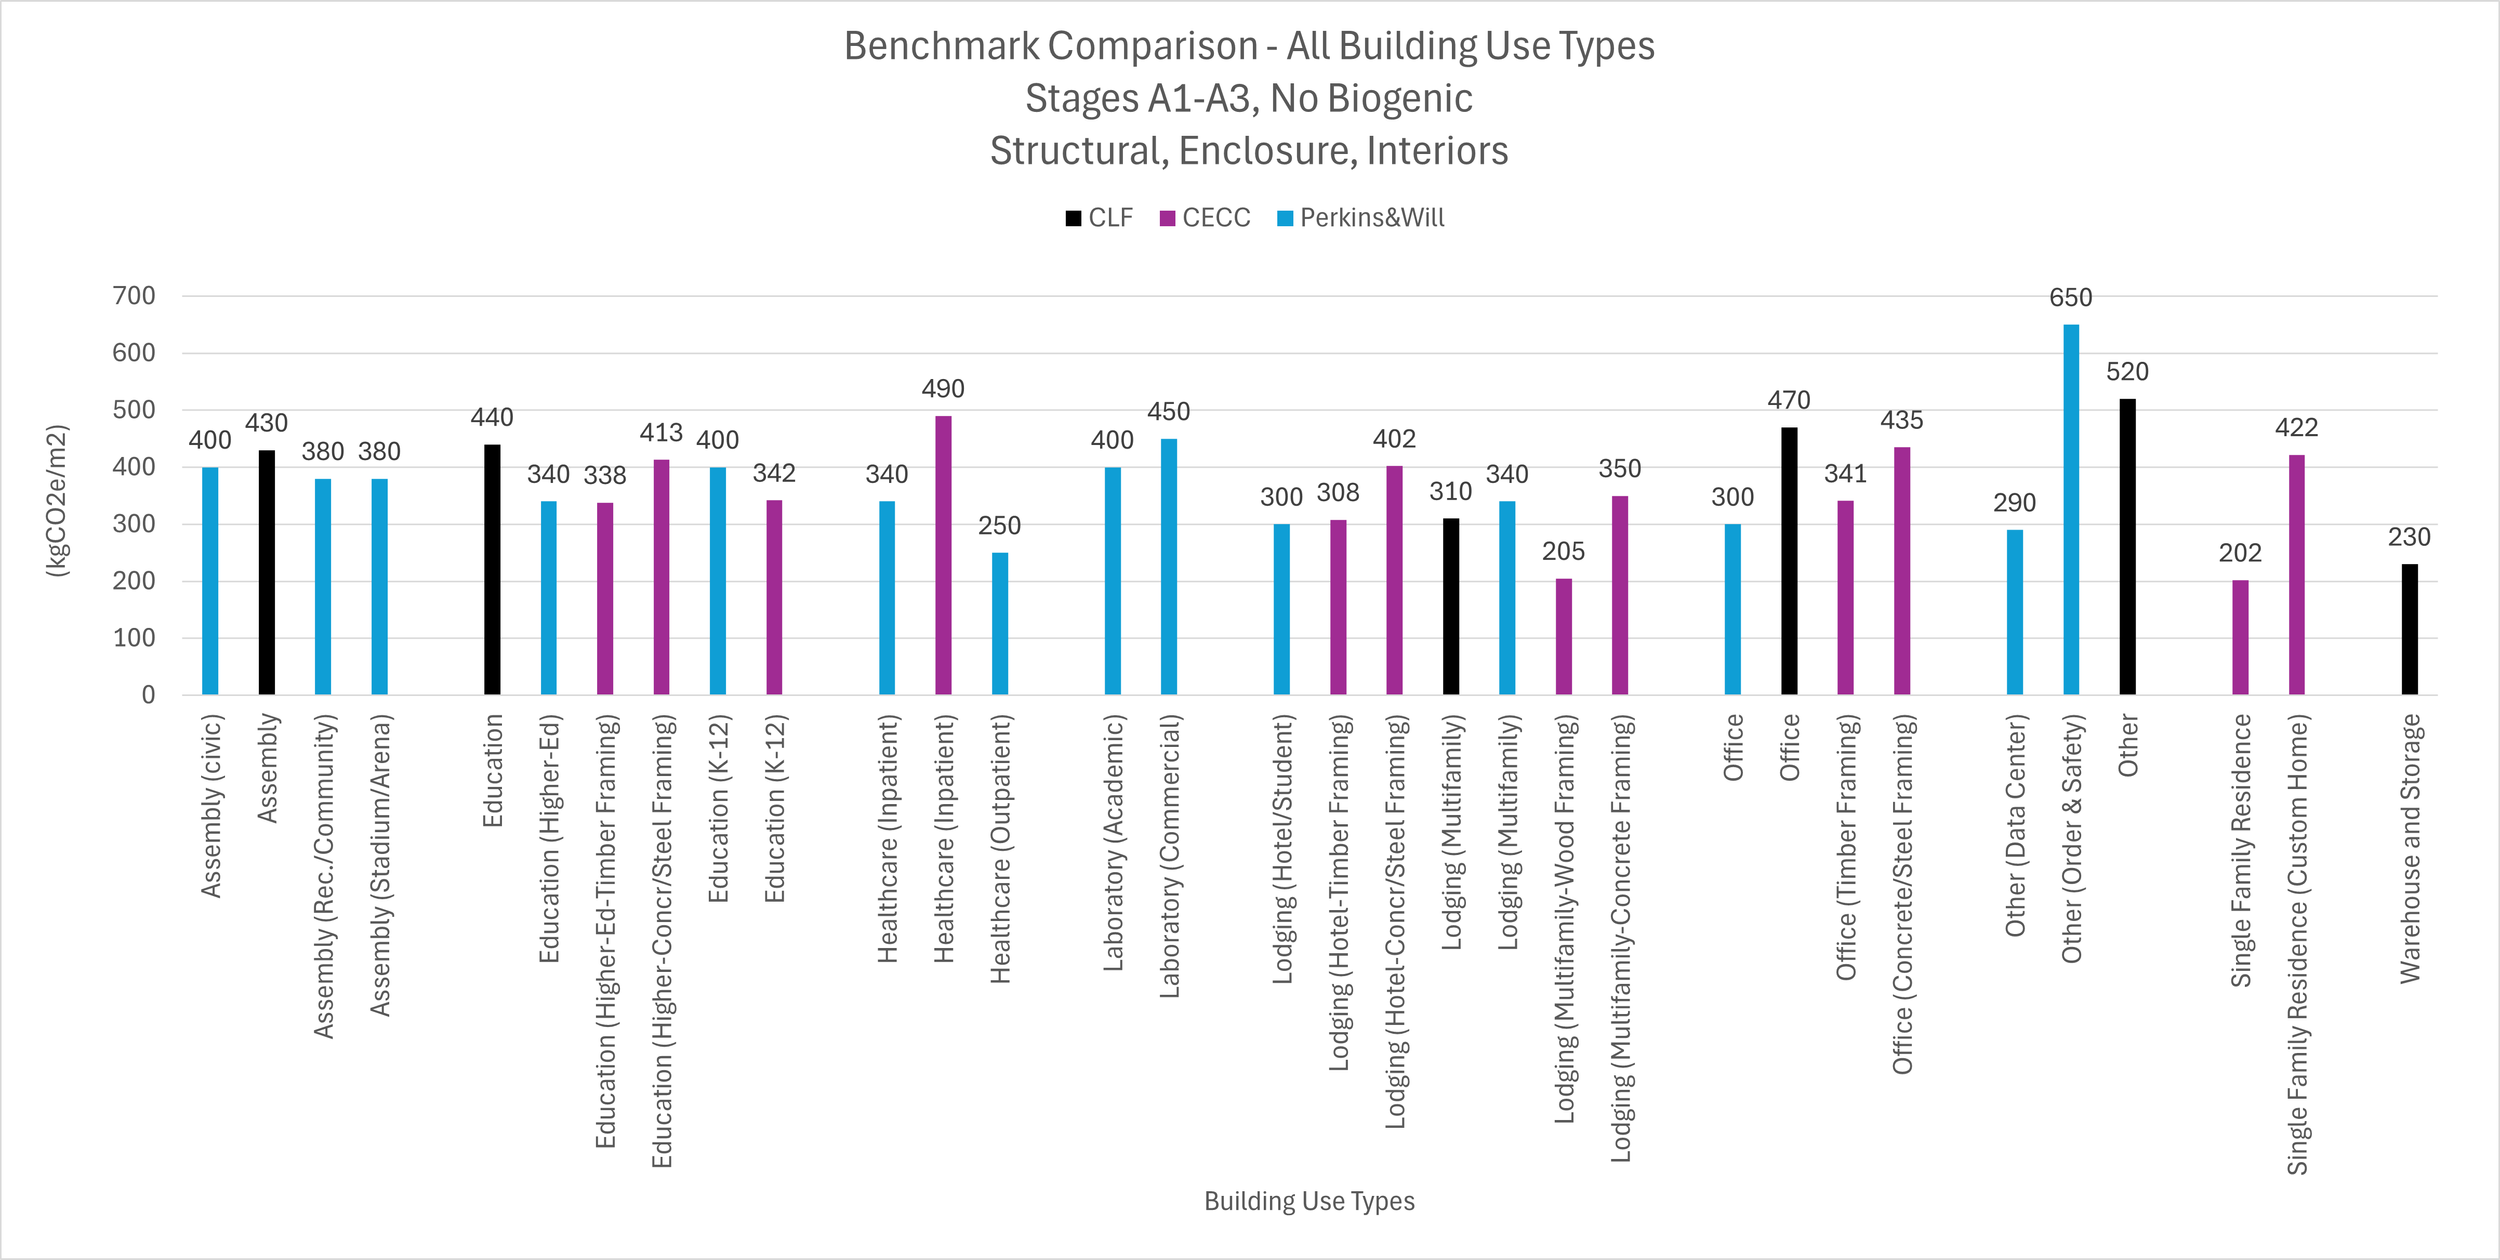
These two charts show the similarity in results of the three data sets used in the comparison, and are considered to be a partial validation of our approach. We are continuing to refine our model and the results presented here are currently being reviewed and checked for modeling assumptions.
To demonstrate the flexibility of the building system approach, here is a series of charts by different building types.