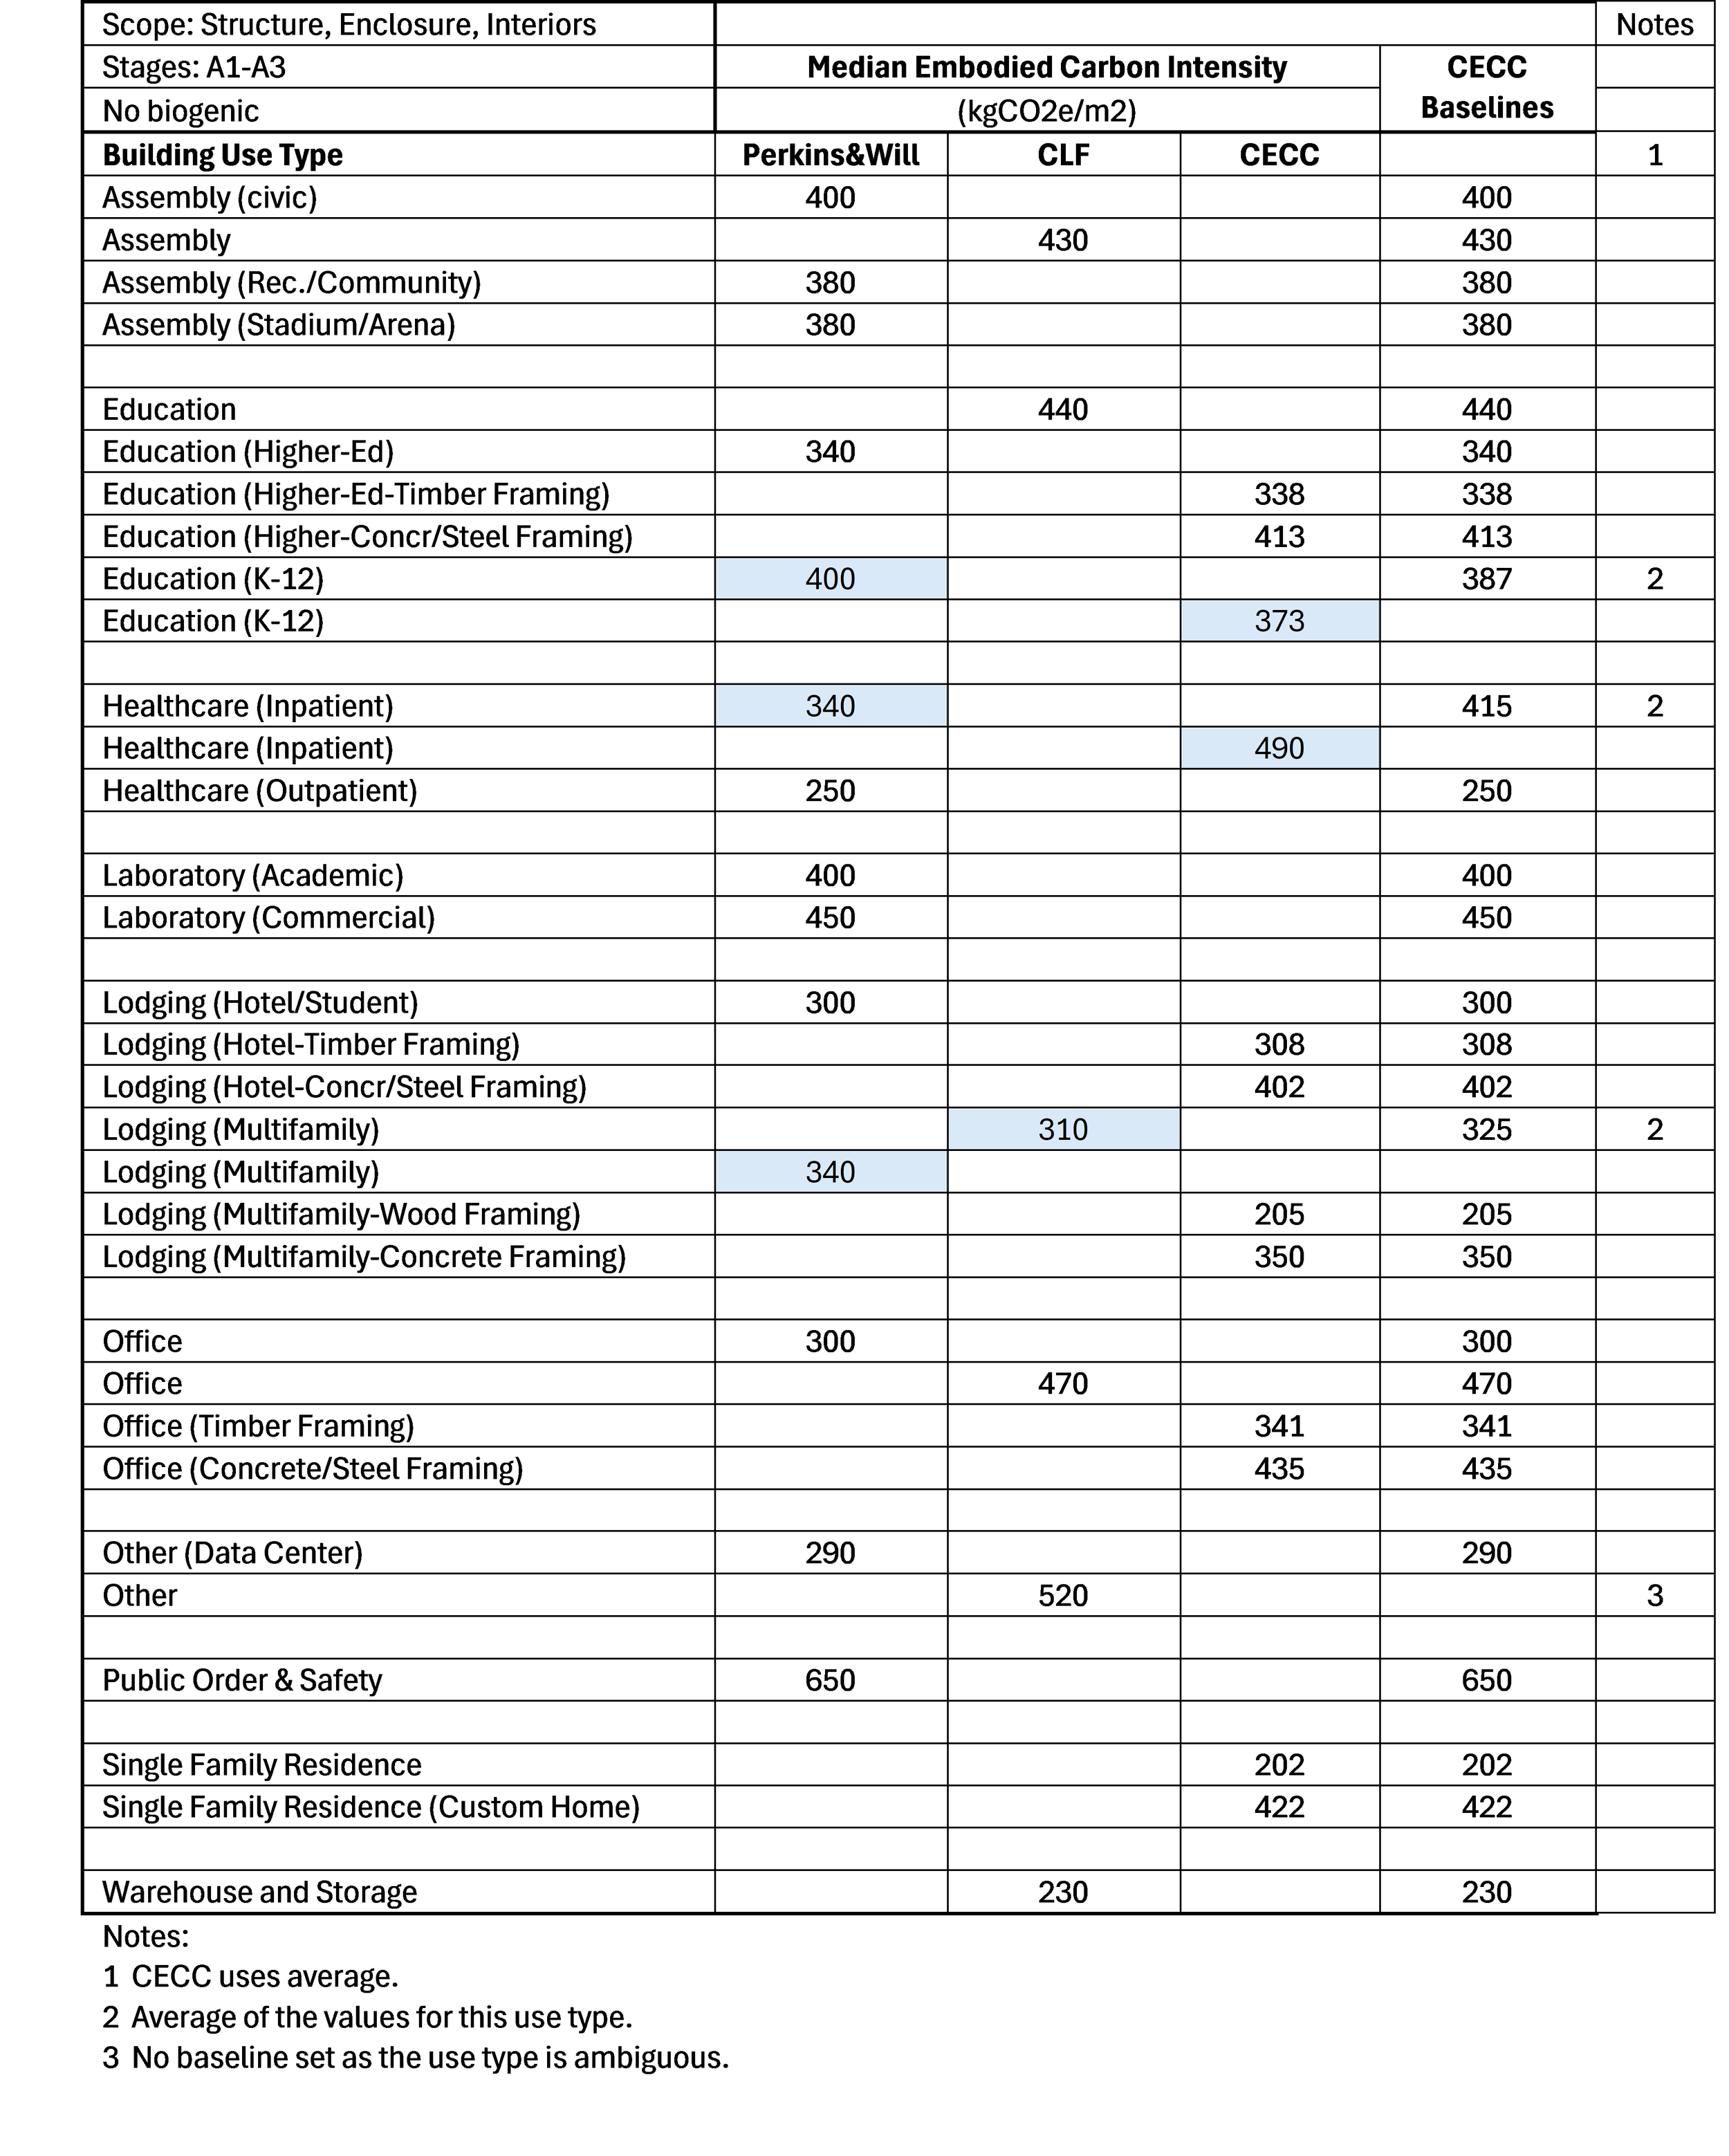
The following chart shows the embodied carbon intensities for the building use types from all three sources, and the resultant CECC Building Baselines.
Our modeling of these baselines is not complete and in addition to ongoing internal review and revisions, we welcome comments by others. We have not provided background information on our modeling methods and are glad to share it with those who would like to help in improving these models.